Expert reviews are powerful tools for improving e-commerce experiences. This guide will help you understand how UX Critique analyzes and presents your evaluation data to drive meaningful improvements.
Understanding the Performance Indicator
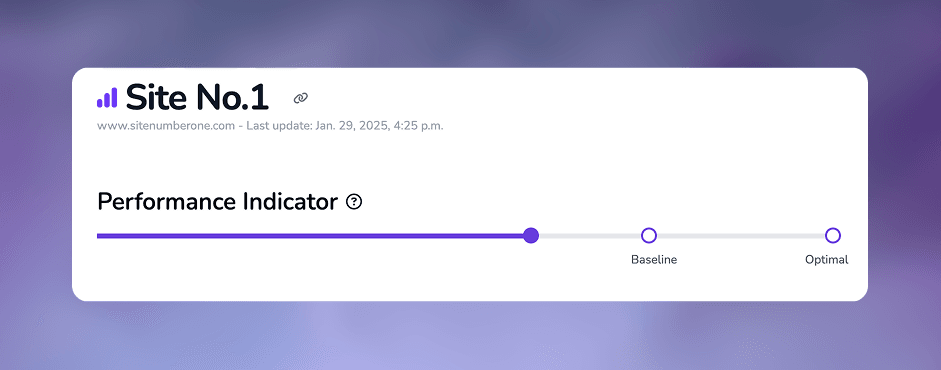
The Performance Indicator is your primary metric for understanding overall UX quality. It shows:
- Current Performance: Represented by a purple progress bar
- Baseline Target (75%): Indicates when all elements meet basic usability standards (score of 3/4)
- Optimal Target (100%): Represents perfect implementation across all elements (score of 4/4)
The progress bar helps visualize how close your site is to reaching both baseline and optimal performance levels.
Areas Analysis
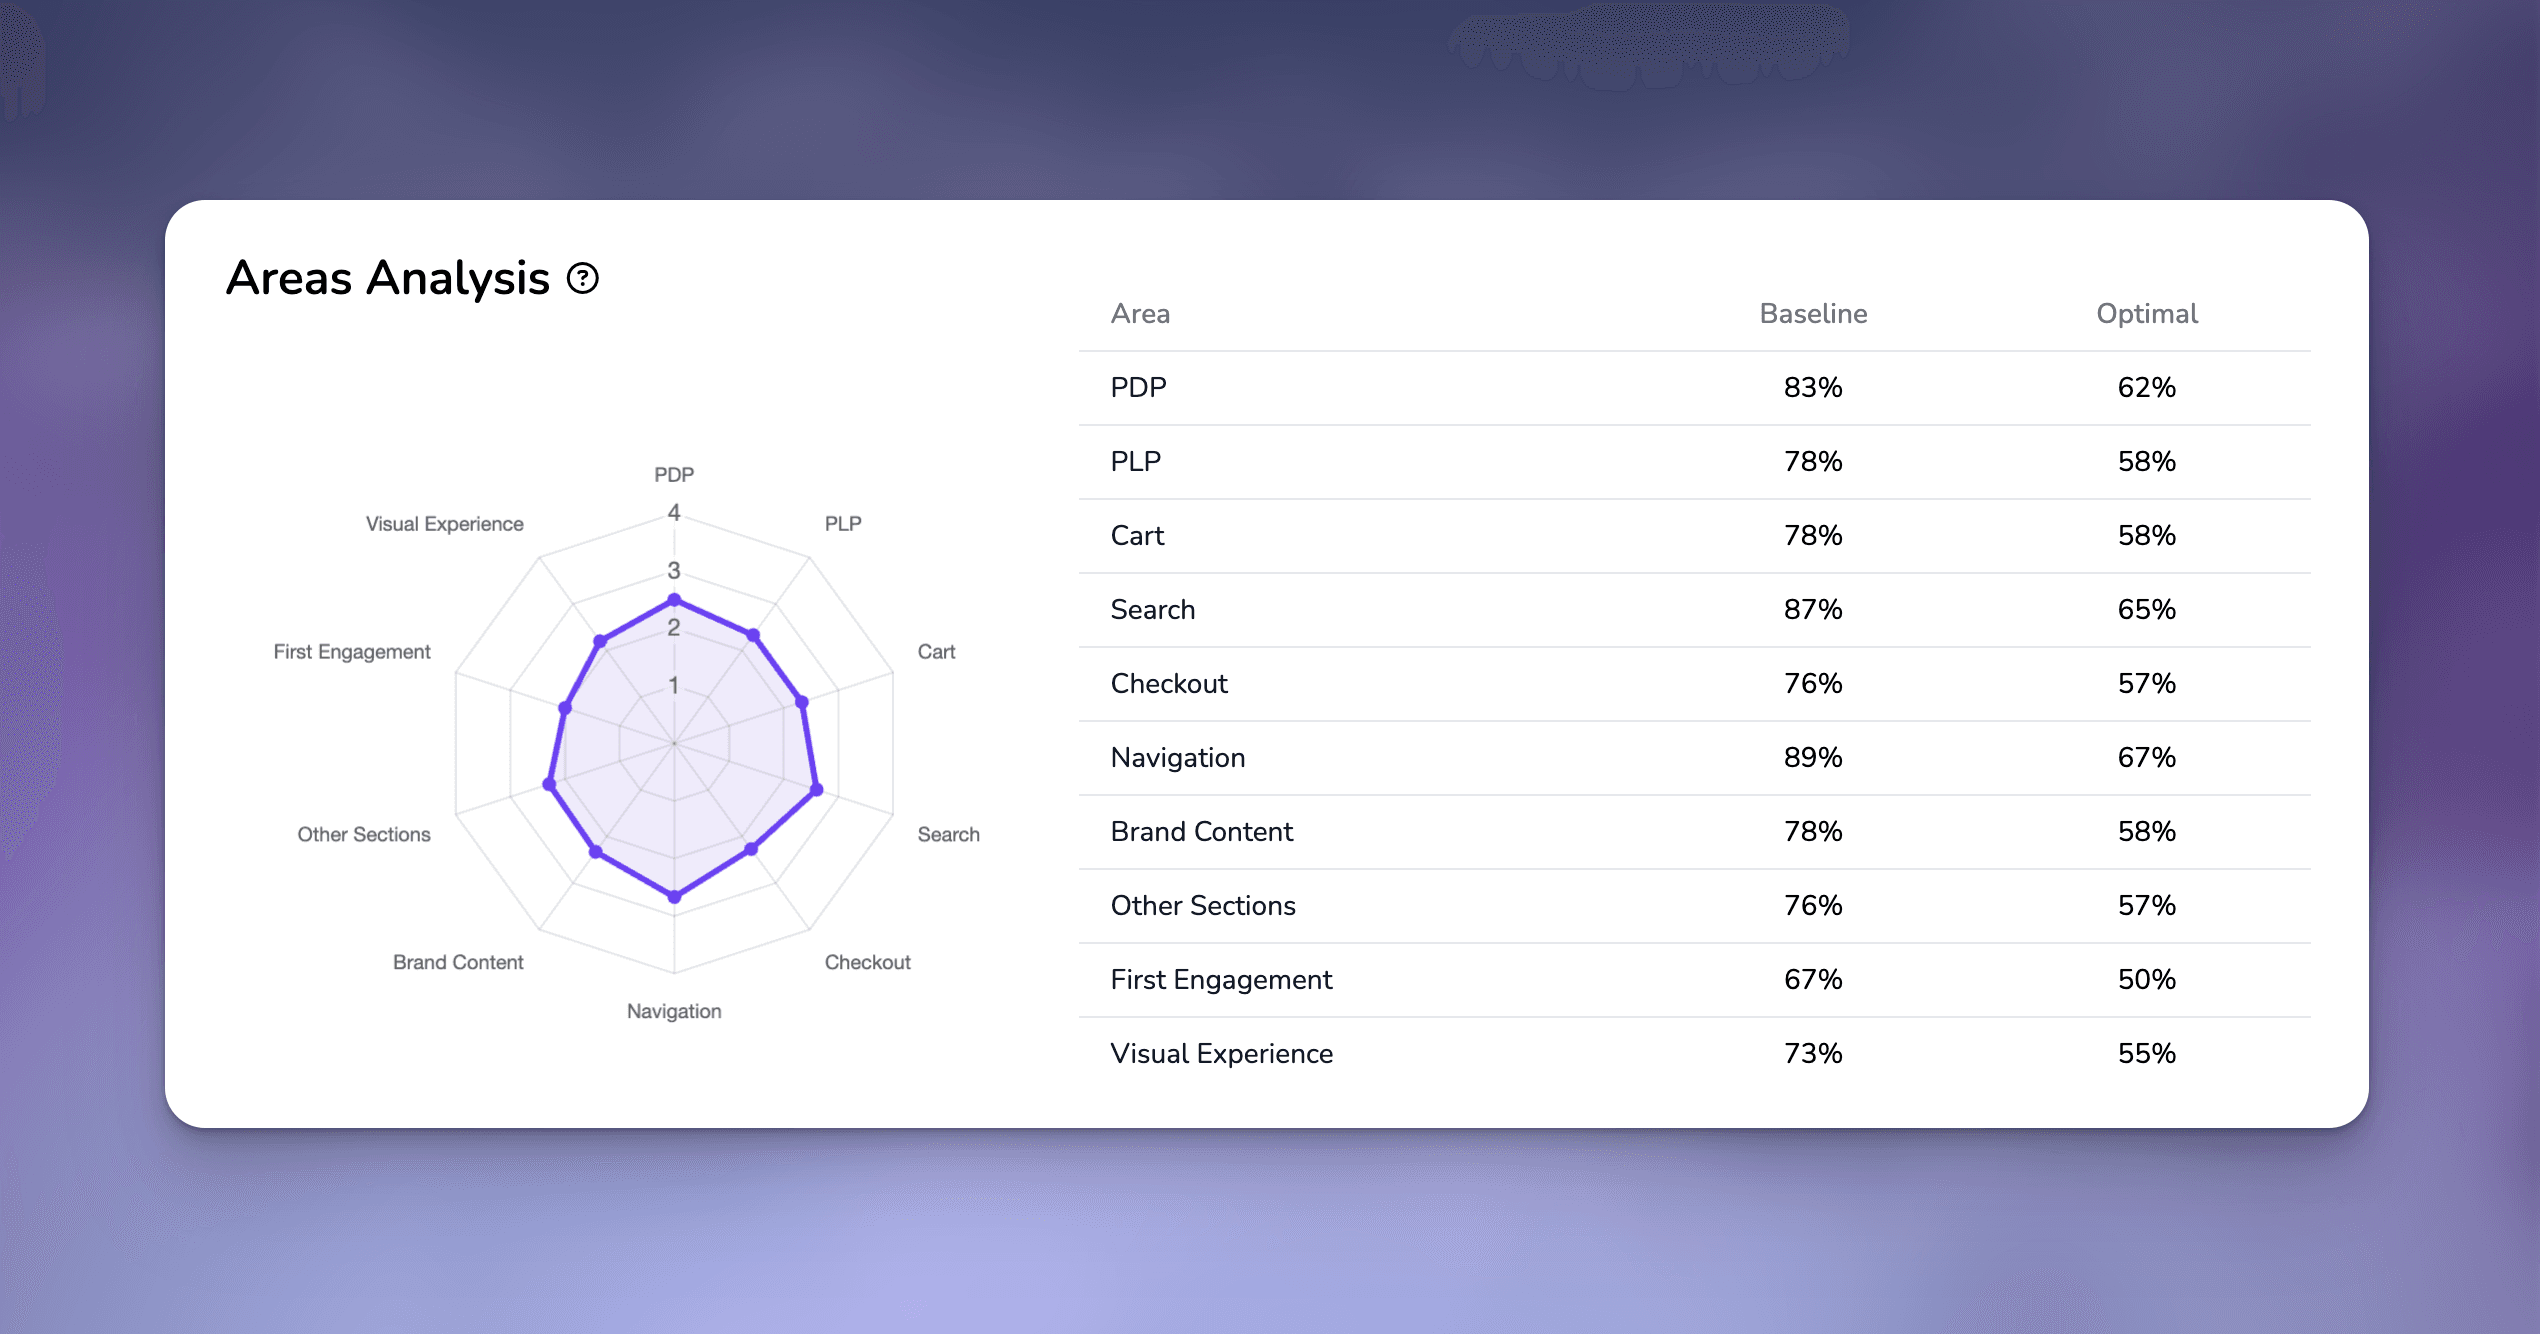
UX Critique provides two complementary views of your performance by area:
1. Radar Chart
- Visualizes the average score (1-4) for each evaluated area
- Helps identify strengths and weaknesses at a glance
- Perfect for spotting patterns and imbalances in your UX implementation
2. Area Scores Table
Shows two key metrics for each area:
- Baseline Score: Percentage of how close you are to achieving all 3s
- Optimal Score: Percentage of how close you are to achieving all 4s
Understanding Improvement Priorities
UX Critique calculates improvement priorities using a sophisticated algorithm that considers:
- Gap to Fairness: The distance between current scores and the baseline target (score of 3)
- Low Scores Percentage: The proportion of scores that are 1 or 2 in each area
- Impact Score: A combined metric (0-1) that weighs both factors
Priorities are categorized into three levels:
- High Priority: Impact score ≥ 0.7
- Medium Priority: Impact score 0.3-0.69
- Low Priority: Impact score < 0.3
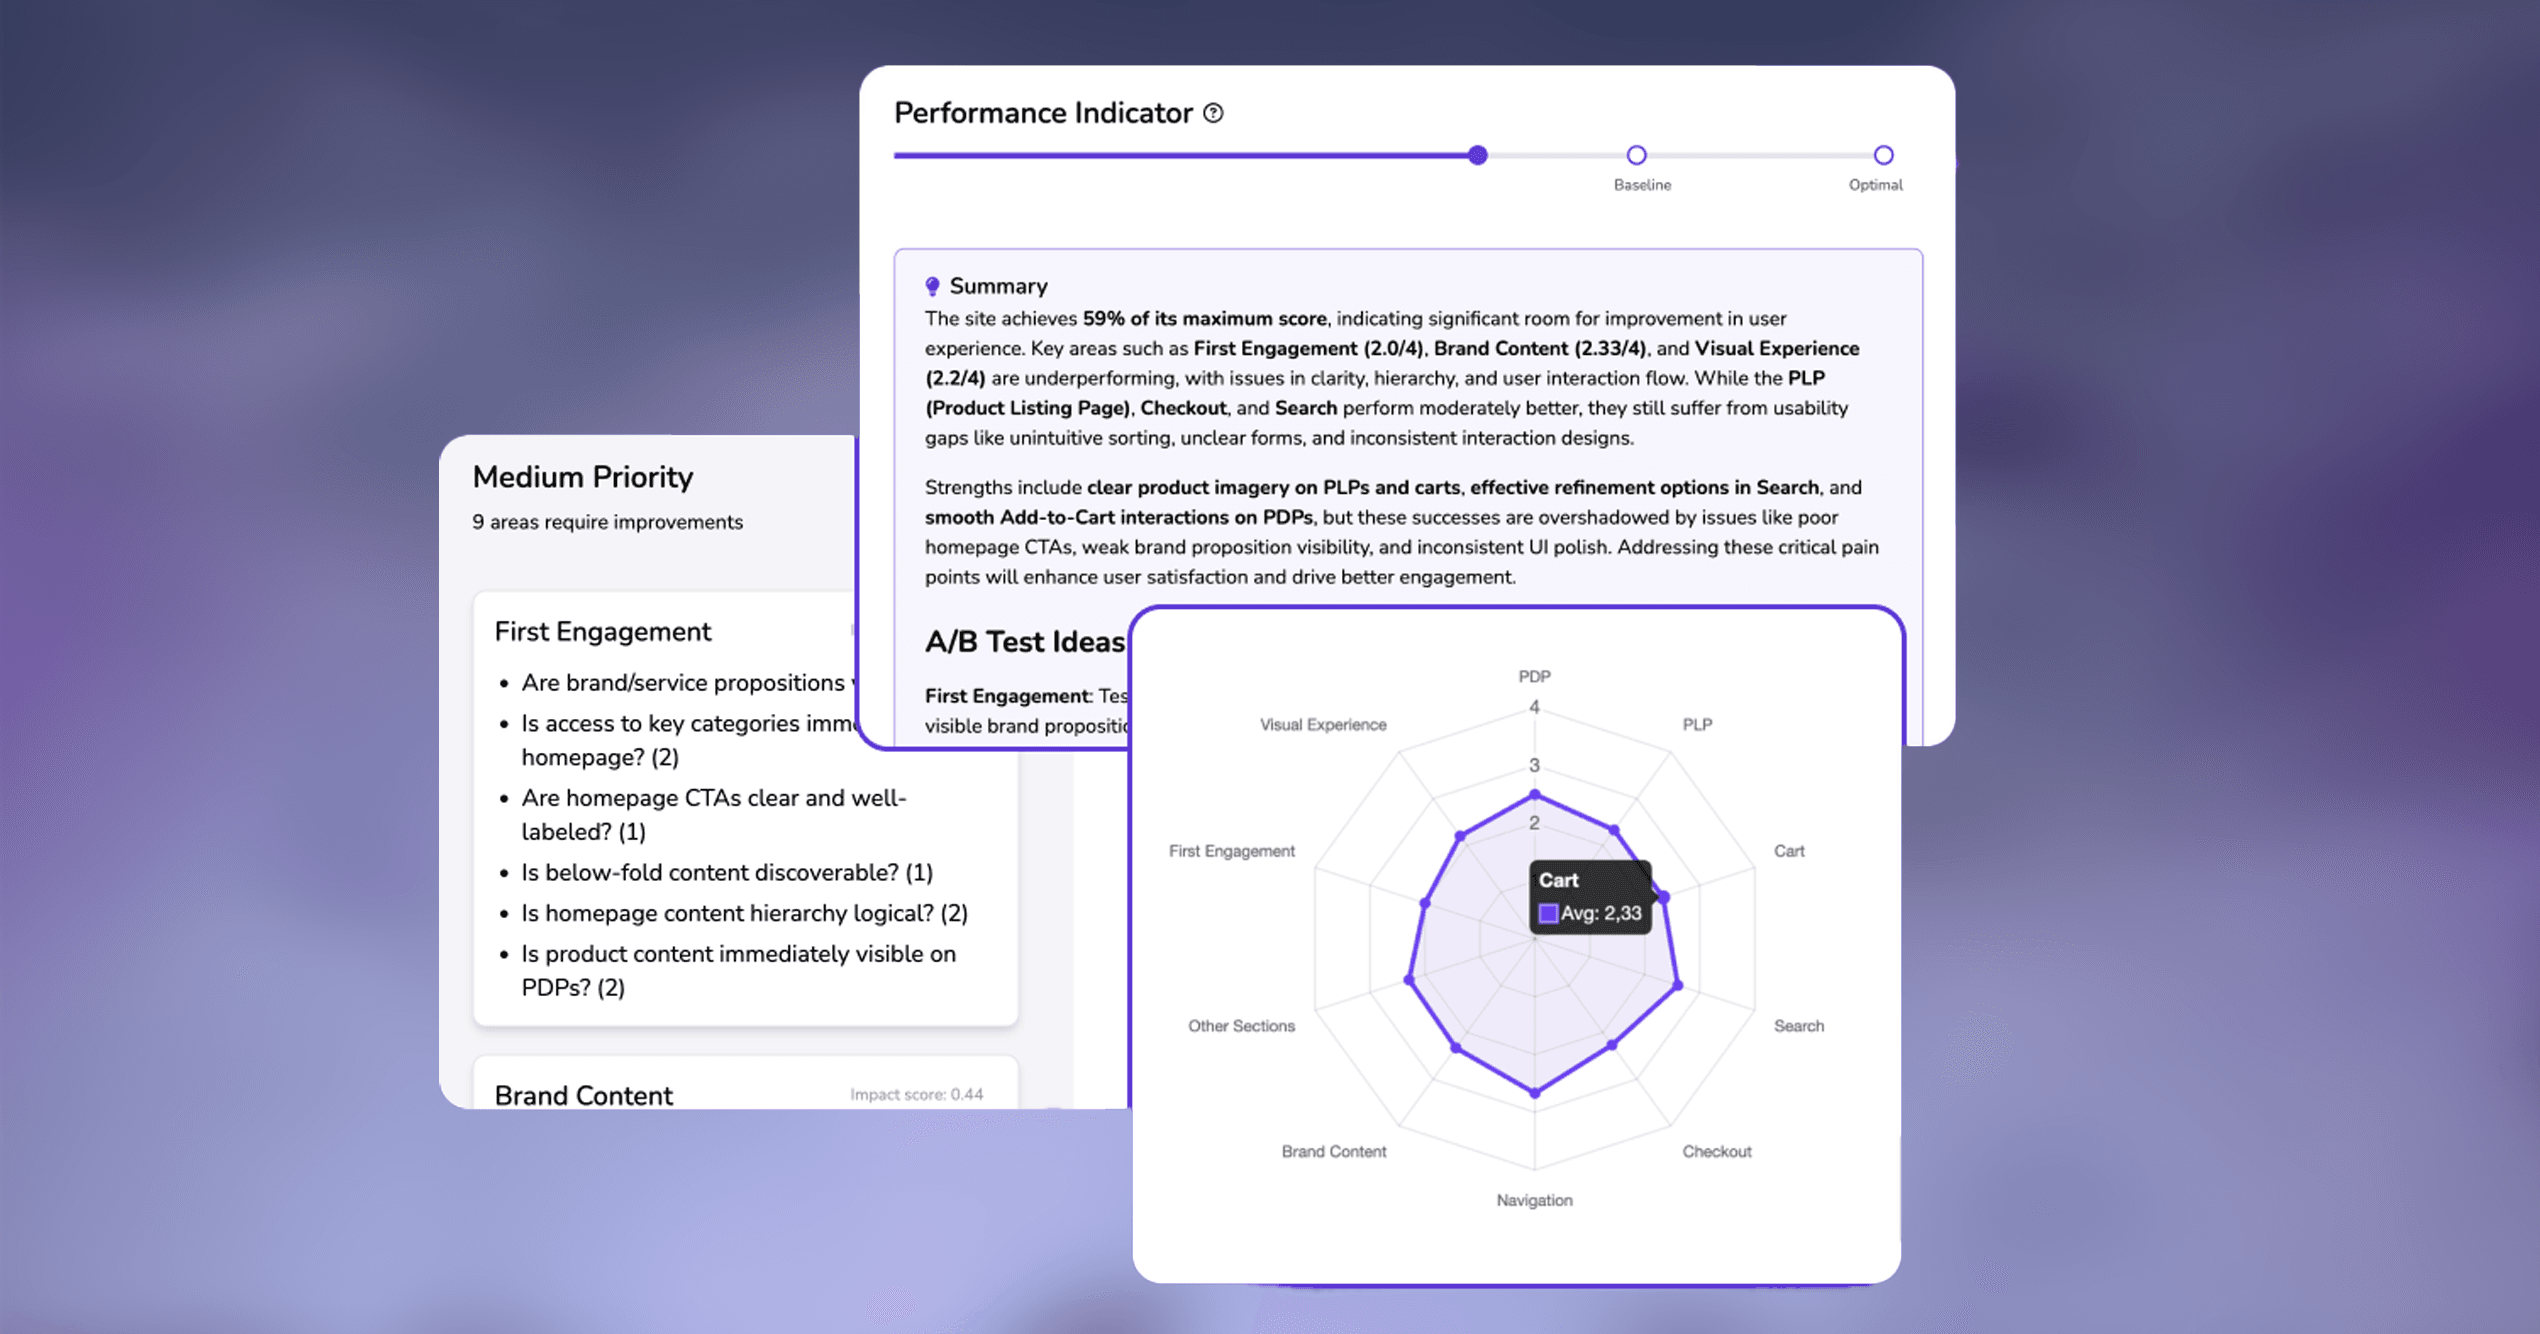
For each priority area, you’ll see:
- Topic name
- Current average score
- Percentage of low scores
- Specific questions that received low scores
AI-Powered Summary
The AI summary provides:
- An overall assessment of your site’s UX
- Identification of critical areas needing attention
- Recognition of well-implemented features
- Specific A/B testing suggestions for improvement
Best Practices for Using the Report
Start with the Performance Indicator
- Understand your overall position
- Note the gap to baseline and optimal targets
Review Priority Areas
- Focus on high-priority items first
- Look for patterns in low-scoring questions
- Use the impact scores to prioritize improvements
Use the Areas Analysis
- Identify underperforming sections
- Look for opportunities to exceed baseline scores
- Plan improvements based on gap analysis
Leverage AI Insights
- Use the AI summary for strategic planning
- Consider suggested A/B tests
- Share insights with stakeholders
The goal is first to reach the baseline score (75%) across all areas, ensuring a consistently good user experience. Once achieved, you can work toward optimal scores to create exceptional experiences that exceed user expectations.